
The efficacy of monetary transition
| Photo Credit:
Andrii Yalanskyi
After having reduced the policy repo rate by 100 bps in quick succession since February 2025, under the current circumstances, monetary policy is left with very limited space to support growth”.
These were significant words in the Governor’s statement on monetary policy in June. This also probably points to the limitations of monetary policy in pushing growth beyond a point as there are other factors at play which have to also fall in place.
In a facetious manner it can be said that if bringing the policy rate to zero by all central banks can spur growth, then there should be high growth across the world. But this is not how it works as interest rates, with the support of transmission, can make an impact only to a certain extent on the growth front.
Monetary transmission
The fundamental question is how does monetary policy transmission work? Lower rates when transmitted by banks enables higher borrowing by customers. But does one borrow merely because rates are low? A company will borrow more only if there is need for investment which is dependent on demand conditions. If there is surplus capacity then borrowing may not be required.
Similarly if an individual is planning to buy a home or car, the cost of capital will not be the clinching factor though it may be a catalyst. When a home loan is taken, there will be phases when rates increase and decrease and hence the borrowing cost will vary over the period of 15-20 years of the loan tenure.
In this context it would be interesting to see how growth in credit and GDP behaved in various interest rate regimes over the last 20 years or so.
There have been essentially 10 interest rate regimes during this period of two decades, with some lasting for just a year. Using regimes has the advantage of taking into account lagged effects of repo rate changes on growth in credit if they involve longer time periods as most models talk of policy working with a hiatus of 3-4 quarters.
The accompanying table gives the path of movement of repo rate along with the average growth in credit and GDP during these periods.
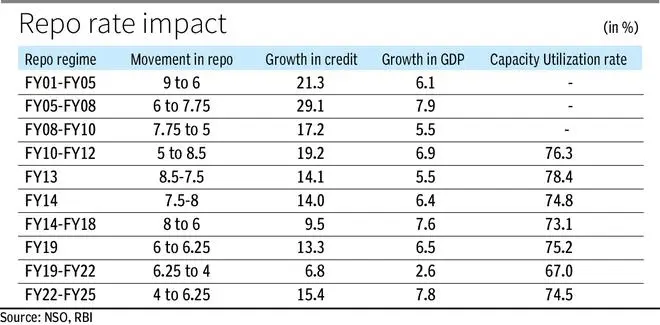
As can be expected the numbers are equivocal. In the four regimes till FY12, growth in credit had been high. However, in both the regimes when the repo rate was increased sharply by 175 bps and 350 bps respectively, GDP growth was higher at 29.1 per cent and 19.2 per cent respectively.
These were also phases when GDP growth was much higher than the two regimes when the repo rate was lowered by 300 bps and 275 bps respectively when growth was 6.1 per cent and 5.5 per cent respectively.
Hence, the sense one gets is that growth in credit is not linked with rates and investment opportunities mattered more. This was the time when investment increased on the back on high capital formation especially in the infrastructure sectors.
The next two regimes can be kept aside as they involved single years and growth in credit was flat at around 14 per cent from a high of 19.2 per cent in the increasing rate regime. The subsequent four regimes went against conventional economic wisdom.
During FY14-18 the repo rate was lowered by 200 bps but growth in credit slowed down to 9.5 per cent while GDP growth was at a high of 7.6 per cent. This was the time when the AQR was introduced and bank lending slowed down while growth remained buoyant. FY19 was again a single year regime of marginally higher rates when credit growth picked up.
The last two regimes are interesting. The FY19-22 period was typified by lowest repo rate and yet growth in credit was low at 6.8 per cent with GDP growth averaging 2.8 per cent. Clearly this was a case of demand falling short which led to lower growth in credit. It was natural that during Covid investment decisions were deferred. This got reversed in the period of FY22-FY25 when rates rose but with GDP growth gathering steam did not come in the way of swift growth in credit.
The demand side
Therefore, there is reason to believe that interest rate impact on growth in credit and GDP cannot be looked at with a singular lens and the demand side factor has to also be brought in. One indicator of demand is the capacity utilisation rate in industry.
Data is not available for the first three interest rate regimes. The average capacity utilisation rate for the various regimes is presented in the last column based on RBI data. This rate indicates the rise or fall in demand as it reflects the spare capacity in industry. Admittedly, capacity utilisation pertains only to manufacturing and not services or the personal loan segments.
The capacity utilisation trend is quite unambiguous. When the capacity utilisation rate moves up, there is tendency for credit growth to also pick up and vice versa. This shows that interest rate is one tool to drive credit growth but is also contingent on how the demand story evolves. As capacity utilisation rates improve there is a tendency for demand for credit to go up for both working capital and investment purposes.
It may hence be concluded that the RBI’s statement is a fair one relating to the impact interest rates can have on growth even if it is assumed that inflation will remain benign given the supply side factors pertaining to food items.
In two of the three phases of high GDP growth, the repo rate had increased while in the third, the policy rate came down but credit growth was in single digit. In the other four phases of lower repo rates, GDP growth was low and the highest achieved was 6.1 per cent in the period FY01-FY05. Therefore, the demand side of the story also needs to play out.
The writer is Chief Economist, Bank of Baroda. Views expressed are personal
Published on July 12, 2025